BUBOR 3-Month Rate Volatility & Fluctuation Analysis
The BUBOR (Budapest Interbank Offered Rate) 3-month rate is a critical benchmark for financial institutions operating in Hungary. Understanding its volatility and fluctuations is essential for risk management, trading strategies, and economic forecasting. This blog post will delve into the analysis of BUBOR 3-month rate volatility, utilizing the Interest Rates API from interestratesapi.com to extract relevant data. We will explore various endpoints to measure changes, visualize trends, and discuss practical applications for developers and financial analysts.
Understanding BUBOR 3-Month Rate Volatility
Volatility in interest rates, particularly the BUBOR 3-month rate, can significantly impact financial markets. It affects loan pricing, investment decisions, and overall economic stability. By analyzing historical data and fluctuations, financial professionals can better understand market dynamics and make informed decisions.
To measure the volatility of the BUBOR 3-month rate, we can utilize the /fluctuation endpoint of the Interest Rates API. This endpoint provides essential statistics such as change, percentage change, high, and low values over a specified date range.
Using the /fluctuation Endpoint
The /fluctuation endpoint allows us to analyze the change in the BUBOR 3-month rate over a defined period. Here’s how to use it:
curl "https://interestratesapi.com/api/v1/fluctuation?start=2025-01-01&end=2025-12-31&symbols=BUBOR_3M&api_key=YOUR_KEY"The expected JSON response will look like this:
{
"success": true,
"rates": {
"BUBOR_3M": {
"start_date": "2025-01-01",
"end_date": "2025-12-31",
"start_value": 5.50,
"end_value": 5.33,
"change": -0.17,
"change_pct": -3.09,
"high": 5.50,
"low": 5.25
}
}
}
In this response, we can see that the BUBOR 3-month rate started at 5.50% and ended at 5.33%, indicating a decrease of 0.17%. The percentage change of -3.09% reflects the rate's volatility over the year.
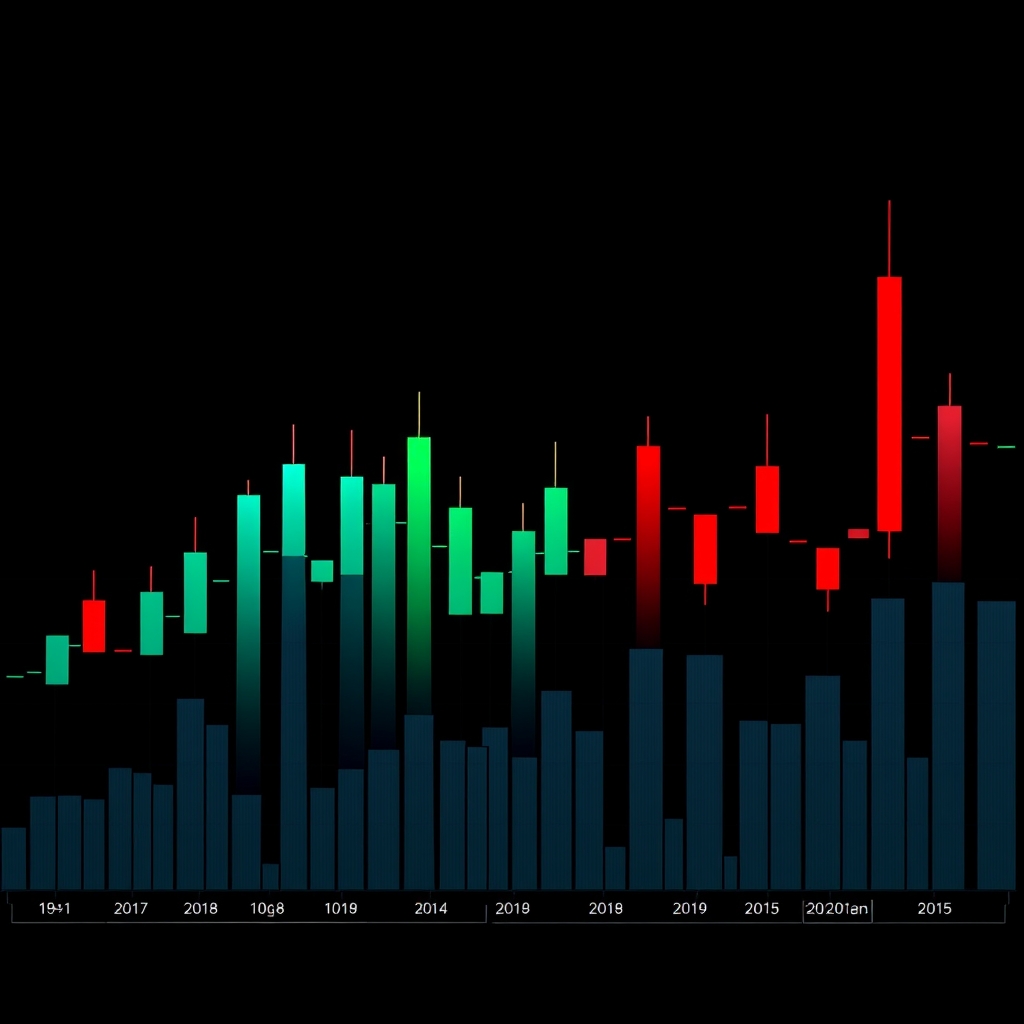
Monthly Candlestick Patterns with /ohlc
To visualize the BUBOR 3-month rate's performance over time, we can use the /ohlc endpoint, which provides open, high, low, and close (OHLC) data. This data is crucial for traders and analysts who rely on candlestick patterns to make informed decisions.
curl "https://interestratesapi.com/api/v1/ohlc?symbols=BUBOR_3M&period=monthly&start=2025-01-01&end=2025-12-31&api_key=YOUR_KEY"The JSON response will provide monthly OHLC data:
{
"success": true,
"period": "monthly",
"start_date": "2025-01-01",
"end_date": "2025-12-31",
"rates": {
"BUBOR_3M": [
{
"period": "2025-01",
"open": 5.50,
"high": 5.50,
"low": 5.25,
"close": 5.33,
"data_points": 23
},
{
"period": "2025-02",
"open": 5.33,
"high": 5.40,
"low": 5.30,
"close": 5.35,
"data_points": 20
}
]
}
}
In this response, each month's data provides insights into the BUBOR 3-month rate's behavior, allowing analysts to identify trends and potential trading opportunities.
Time Series Analysis with /timeseries
For a more granular analysis, the /timeseries endpoint can be used to retrieve daily rates over a specified period. This data is invaluable for calculating rolling volatility and understanding short-term fluctuations.
curl "https://interestratesapi.com/api/v1/timeseries?start=2025-01-01&end=2025-12-31&symbols=BUBOR_3M&api_key=YOUR_KEY"The expected JSON response will include daily rates:
{
"success": true,
"base": "USD",
"start_date": "2025-01-01",
"end_date": "2025-12-31",
"rates": {
"BUBOR_3M": {
"2025-01-01": 5.50,
"2025-01-02": 5.50,
"2025-01-03": 5.45,
"2025-01-04": 5.40
}
},
"frequencies": {
"BUBOR_3M": "daily"
},
"currencies": {
"BUBOR_3M": "USD"
}
}
With this data, we can calculate rolling volatility using Python and the Pandas library:
import pandas as pd

# Sample data
data = {
"2025-01-01": 5.50,
"2025-01-02": 5.50,
"2025-01-03": 5.45,
"2025-01-04": 5.40
}

# Create a DataFrame
df = pd.DataFrame(list(data.items()), columns=['Date', 'Rate'])
df['Rate'] = pd.to_numeric(df['Rate'])

# Calculate rolling volatility
df['Rolling Volatility'] = df['Rate'].rolling(window=3).std()
print(df)
This code snippet demonstrates how to calculate the rolling standard deviation of the BUBOR 3-month rate, providing insights into its volatility over time.
Practical Applications of BUBOR Analysis
Understanding the BUBOR 3-month rate's fluctuations has several practical applications:
- Rate-Alert Systems: Developers can create systems that alert users when the BUBOR rate reaches a certain threshold, helping them make timely financial decisions.
- Value at Risk (VaR) Models: Financial analysts can incorporate BUBOR data into their VaR models to assess potential losses in investment portfolios.
- Central Bank Meeting Event Analysis: By analyzing BUBOR fluctuations around central bank meetings, economists can gauge market expectations and potential policy changes.
Conclusion
The BUBOR 3-month rate is a vital indicator for financial markets in Hungary. By leveraging the Interest Rates API from interestratesapi.com, developers and analysts can access comprehensive data to analyze rate volatility, visualize trends, and implement practical applications. Understanding these fluctuations not only aids in risk management but also enhances trading strategies and economic forecasting.
For more information on how to utilize the Interest Rates API, visit Explore Interest Rates API features and Get started with Interest Rates API.